Infographics 101
How to create your own gorgeous infographics
Infographics. You’ve seen them floating around on Facebook, popping up on Pinterest, and telling it like it is on Tumblr. They show up in blog posts and news articles. They’re easy to share and some go viral. And why wouldn’t they? Great infographics lay out the facts in a well-organized manner with top-notch design. They’re a fantastic way to catch someone’s eye as they quickly scroll through their newsfeed. It may look like you need a team of designers to create one that's perfectly suited for your content needs, but they're easier to create than it may look and you just might have fun creating them.
While infographics have seen a definite surge in popularity within the past decade, they have a much earlier start than their modern counterparts would have you believe. Some of the first published infographics were by Christoph Scheiner in 1626 which were illustrations of the sun’s rotations.
What are infographics exactly?
Infographics show up all over the place. You’ll find them in doctors' offices and on school walls. In magazines, textbooks, and all over the internet. Infographics are a form of content that we continue to return to over the centuries because they're designed to capture your attention and enhance your comprehension of a single topic. It wasn’t until recently that graphic designers took this easily digestible form of communication and gave it a streamlined, modern look. They make readers stop and consume it - even if they weren’t looking to learn about the steps involved in becoming a beekeeper. They look good and convey information well and the good news is that the internet has made creating a custom infographic for your needs much easier.
Creating your very own infographic!
Before you get started, you’ll need to choose a graphic design platform. If you have experience with graphic design, you know many of these tools already. If, however, you don’t have a background in graphic design, there are plenty of sites out there that offer templates that you can copy and paste your information and images into. They vary in skill level and many have free and paid versions. This allows you to test them out to find one that’s easy for you to use and also has design templates you like.
Brainstorming and researching content ideas.
Once you pick out your platform it’s time to figure out what you’re going to turn into an infographic. It’s important to note here that not all topics will translate into an infographic. Find someone you can bounce ideas off of and then brainstorm and research topics that help to enrich your followers. No, this isn’t a research paper per se, but you do need to provide sources to back up the facts you’re providing if you want to build trust with your followers. These sources can be internal or external. Internal sources are those that you or your business have discovered while external sources come from places outside of your business. Think of an internal source being something like results from a survey that you completed to find out how many people have considered beekeeping as a hobby while external sources would be things like news articles on the benefits of keeping bees. You can use one set or both, but the key here is to make sure you’re able to distill the information down into simple concepts that fit together to tell a story.
Now you’re ready to start infograph-ing!
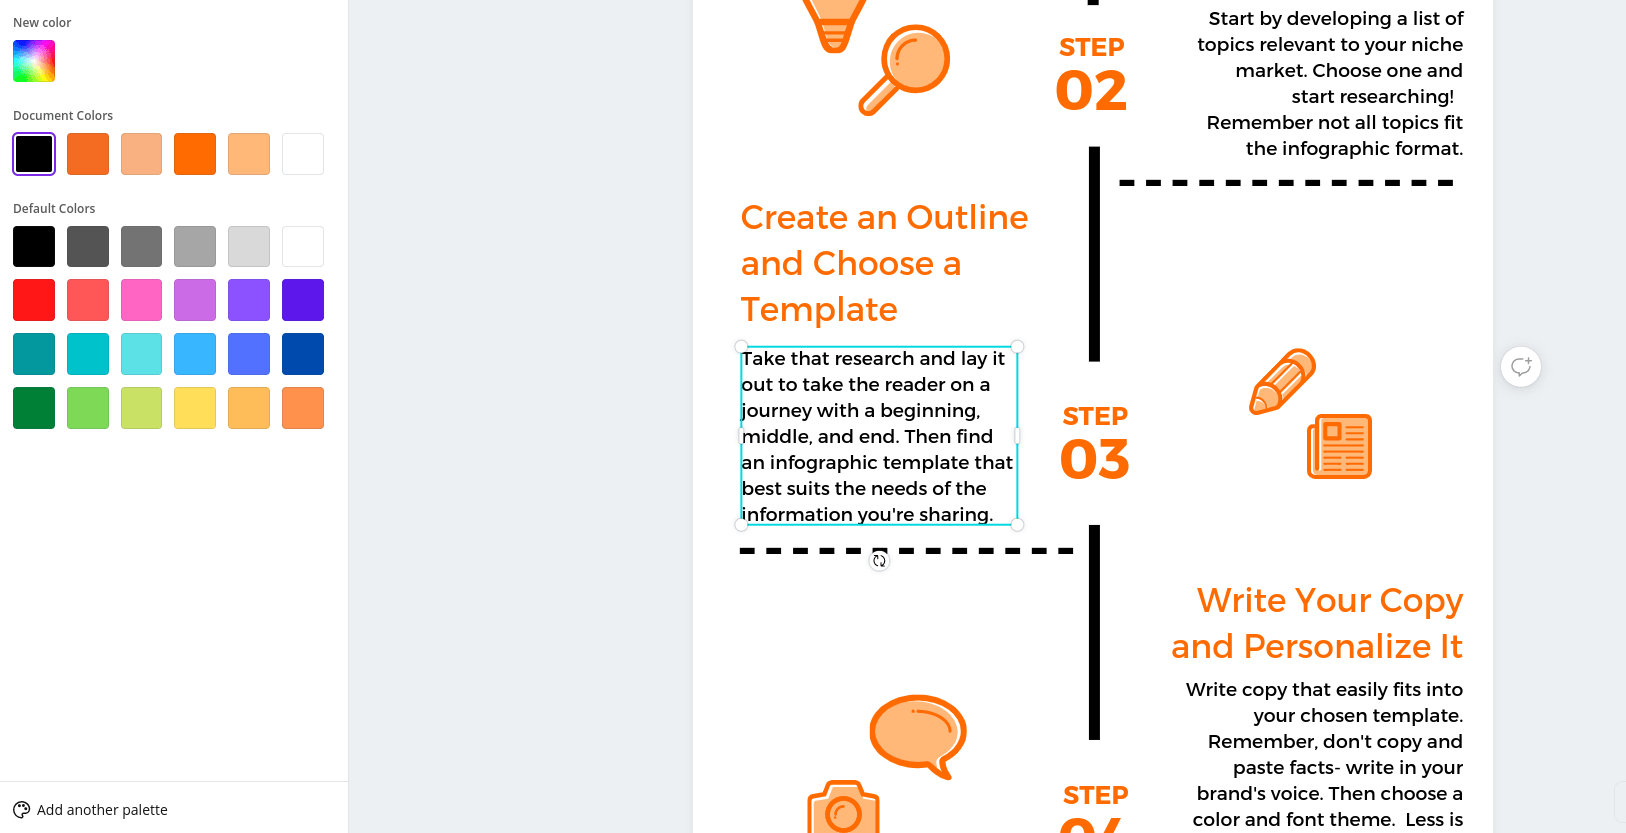
- First, start by creating an outline. Like all stories, good infographics have a beginning, a middle, and an end.
- Next, figure out what kind of infographic you’ll want to use to share your topic. There are many different types of infographics to share different types of information. If your infographic shows the growth of the number of beekeepers in the US over time you might want to use a graph template. If you’re sharing how many bees are kept in specific locations a heat map might suit you better.
- Once you’ve got that sorted out it’s time to write your copy (the content). Keep it simple and short. Most people scrolling through Facebook aren’t looking to read a novel.
- Make sure it’s in your or your brand’s voice. Don’t copy and paste directly from your sources or your infographic will be disjointed and not as enjoyable to read. You want to treat this as if an acquaintance happened to ask you about beekeeping but you both have places to be.
- Now it’s time to move on to color, font, and images. Color is important because it’s what will capture the reader’s attention. Stick with a small color palette, 2-3 colors. You can go with complimentary, some version of your brand colors, or maybe a thematic choice, like black and yellow.
- Make sure it’s readable or no one will pay attention to it. Zoom in and out of the image on the template. Look at it on different screens (e.g., phone, tablet, computer) and even stand a few feet away from it if that helps. Make sure you can easily read and see the words and images.
- Give your infographic a clean and cohesive look by using images that have the same or similar design style. Try to stick to 1-2 different font styles. Too many different fonts or images can appear messy and distracting.
- Remember, the goal of infographics is to share large amounts of information quickly and easily.
If you’re looking to up your content game to continually build your relationships with your customers infographics are a great way to do that. The internet has made it easier to create infographics customized for your brand and audience and is a great source of easy-to-use tools. Sharing a well-designed infographic helps to keep your audience engaged with your brand. The benefits don’t stop there! Your followers can help to expand the reach of your brand through sharing your content. Maybe it’s time you considered including the occasional infographic in your marketing strategy?
Need help crafting expert infographics? Contact us for a no-obligation consultation with our team of experts today!